 Open in QGIS
The same sites, verdicts, skylines and terrain, as map layers.
QGIS is a free, open-source mapping program used by people who work with geographic data. If you use it, you can open everything Four Lights shows as real map layers, put your own data beside ours, measure, restyle and print. One small project file is all you download: the layers themselves are read from this site as you pan and zoom.
1. Get QGIS
Download it from qgis.org/download. It is free and runs on Windows, macOS and Linux.
- Version we made and checked this with
- QGIS 4.2 (with GDAL 3.12, the library QGIS uses to read files).
- Other versions
- Any QGIS 4 should open the project. QGIS 3 has not been tested: it will warn that the project was saved by a newer version, and may not show everything as intended. The layer files themselves are standard formats that recent QGIS 3 releases also read, so there you can still add them one at a time (see below).
- Nothing else to install
- No plugins, no account, no database.
2. Open the project
- Download four-lights.qgs (the QGIS project, under half a megabyte).
- Open it in QGIS: double-click the file, or in QGIS choose Project → Open.
- Wait a few seconds while the layers load from this site. You need to be online: the project holds the styles and the addresses, not the data.
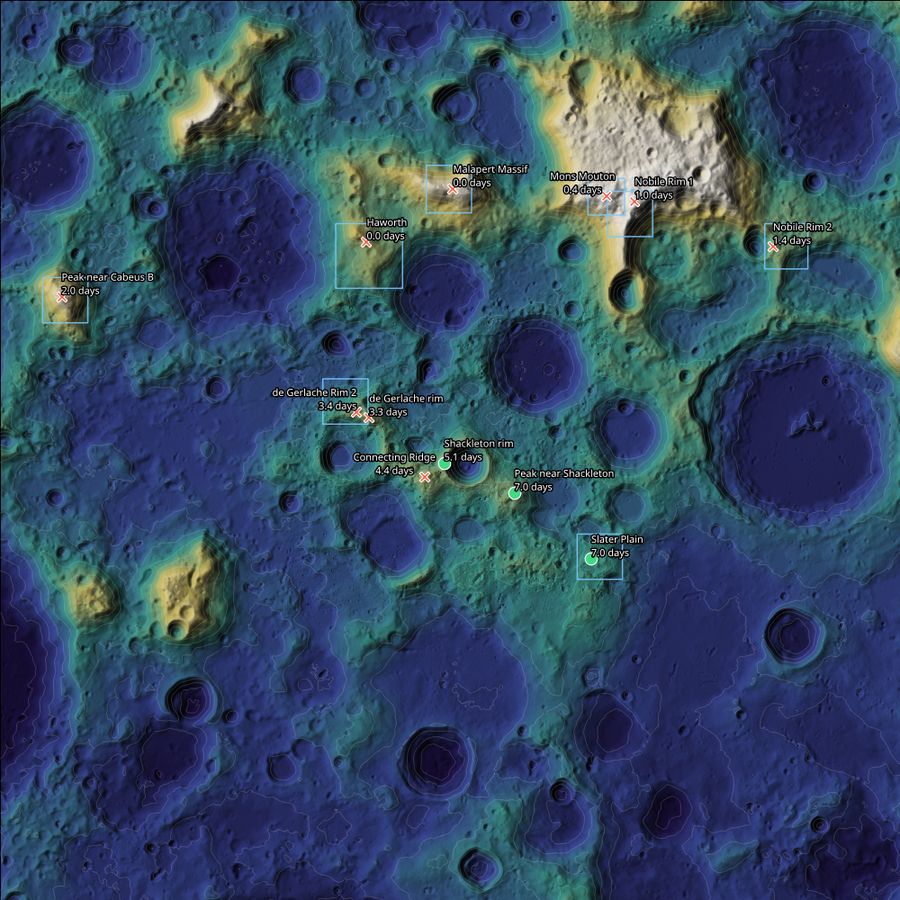
It opens on the south pole with the 12 sites coloured and shaped as in the app's Slip Planner for the demo scenario: a landing planned for 19 April 2028 that slips three days.
3. What is in it
| In QGIS | What it shows |
|---|---|
| Map themes (the eye button above the layer list) | "1 After the slip" and "2 Planned landing": the 12 sites with the app's verdict and usable days for each date. "3 Time slider", "4 Terrain 20 m and slope" and "5 Pipeline checks" switch to the other sets of layers. |
| Time slider (View → Panels → Temporal Controller, then play) | The "Landing day" layer has one point per site and landing day for 2028 and 2029 (8,700 points), so the verdicts change as the date moves. |
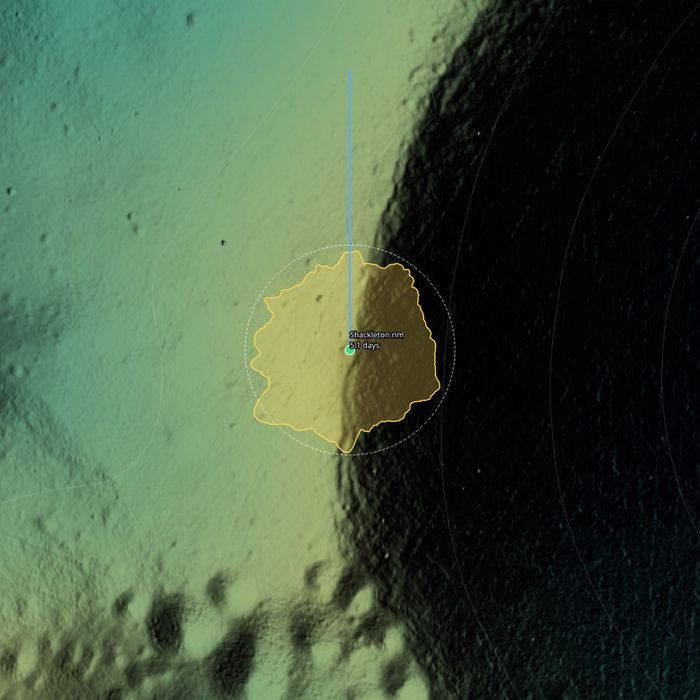
| Spatial bookmarks (View → Show Spatial Bookmarks, group "Sites") | Jump to any site. Zoomed in past 1:400,000 each site shows its 360° skyline drawn around it (further out means higher terrain; the dashed circle is a level horizon) and a line towards the Earth. |
| Map tips (View → Show Map Tips, then hover a site) | Both dates' verdicts, the Sun in view, the longest dark spell, the ground height and how the site's point was chosen. |
| Terrain group | Height coloured over a hillshade, 1000 m contours, and three 20 m layers of the 150 km around the pole: height, hillshade and slope (under 5° clear, then 5 to 10, 10 to 15, over 15°). |
| Regions | The outlines of the 8 USGS Artemis navigation grids we use. |
| Project → Layouts → "Four Lights A4" | A page ready to print: the slip map, a legend, a scale bar and the credits. |
Nothing is worked out again for QGIS: the verdicts and usable days are the app's own numbers, and the skylines are the ones the app uses. All layers are in the Moon south polar stereographic system (IAU_2015:30135). Heights are above a sphere of radius 1737.4 km.
Sample file for offline use
four-lights.gpkg (3.8 MB) is every vector layer in one GeoPackage: sites, the day-by-day planner, skylines, Earth directions, regions, contours and the pipeline's check layers. Drag it onto QGIS, or use Layer → Add Layer → Add Vector Layer. It comes without the project's styles, and it works with no connection. GeoPackage is an open standard, so other GIS software reads it too.
Add one layer to your own project
Each layer is a plain file at a fixed address, so you can add just the ones you want to a project of your own. In QGIS: Layer → Add Layer → Add Vector Layer (or Add Raster Layer), set the source type to "Protocol: HTTP(S), cloud, etc." and paste the address.
| Layer | Address | Format |
|---|
How it is served
There is no map server and no database behind this. The vector layers are FlatGeobuf files and the rasters are Cloud Optimized GeoTIFFs: both are laid out so a program can fetch just the part it needs. QGIS asks for a few thousand bytes at a time, and our Cloudflare Worker answers those requests from static files. The three 20 m rasters are 30 to 65 MB each, too big to be static files, so they sit in Cloudflare R2 storage and are read the same way. Looking at one 5 km square of the 61 MB hillshade downloads about 0.4 MB.
Terrain: NASA LRO LOLA elevation models. Regions: USGS Artemis navigation grids. Sun and Earth directions: NASA JPL Horizons. Details and citations are on the data sources page; the pipeline is described in how we built it.
If something does not load
- Every layer is marked unavailable
- QGIS could not reach this site. Check the connection, then Project → Open again. On a network that blocks or rewrites downloads, use the offline GeoPackage instead.
- QGIS says the project was saved by a newer version
- You are on QGIS 3. Try it anyway, or add the layers one at a time from the table above.
- The map is empty after opening
- Choose a map theme with the eye button above the layer list, or zoom to a layer.